Hi,
I will explain What is the Oracle AWR ( Automatic Workload Repository ) report in this article.
Oracle AWR
If you don’t know how to get or generate Oracle AWR report, please read following article.
Automatic Workload Repository ( AWR ) Report
Oracle Database periodically triggers the MMON (Manageability Monitor Processes) background process and collect the Database statistics and the Snapshot of the Workload information, and saves this data to the several tables in the sys schema within the SYSAUX tablespace.
This database statistics data taken as snapshots is collected every 60 minutes as default and is saved in WRM $ _SNAPSHOT, WRM $ _DATABASE_INSTANCE, WRM $ _WR_CONTROL, WRH $ _SQL_PLAN, WRH $ _SEG_STAT, WRM $ SNAP_ERROR and WRM $ _BASELINE vbvb. Tables data are kept by default for 7 days.
AWR Views are like DBA_HIST_SNAPSHOT, DBA_HIST_DATABASE_INSTANCE, DBA_HIST_WR_CONTROL, DBA_HIST_SQL_PLAN, DBA_HIST_SEG_STAT, DBA_HIST_SNAP_ERROR and DBA_HIST_BASELINE are created from these tables and these views are used for AWR report creation.
This is called the AWR (Automatic Workload Repository) report. AWR reports were first introduced to us with Oracle 10g. We use this detailed Database Statistics report, especially at solving problem or during problem identify.
But what does this AWR Report collect from the database to give detailed information about the system? The data collected are as follows.
- Server load profile ( CPU,Memory Utilization etc. )
- Database Load Profile ( Transaction count, DB Time, Hard Parse, Physical read and etc. )
- TOP SQL by CPU,Elapsed Time,Buffer Gets,IO and etc.
- Wait events in database
- Table,index,trigger etc. usage stats
- Session stats like V$SESSTAT and V$SYSSTAT
- Session Historical stats like V$ACTIVE_SESSION_HISTORY.
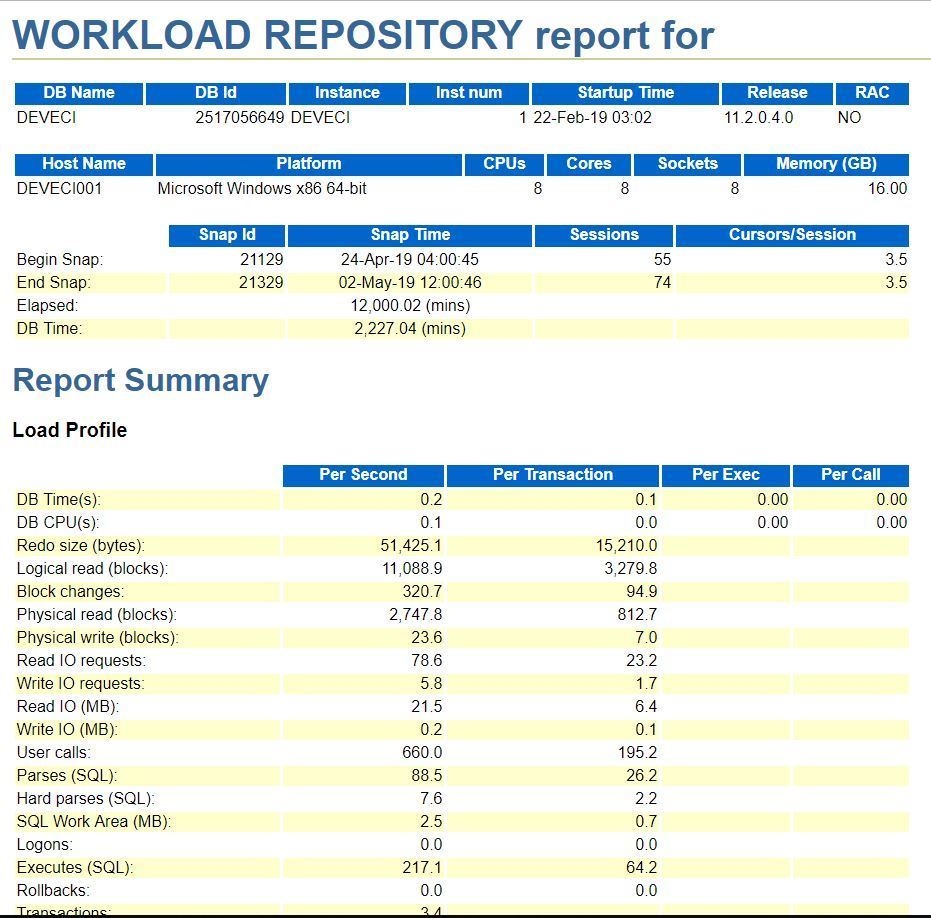
These Performance data and AWR Report sections are like following.
WORKLOAD REPOSITORY report for

Top 10 Foreground Events by Total Wait Time
Host CPU
SQL Statistics
SQL ordered by Elapsed Time

SQL ordered by CPU Time

If you don’t know how to analyze Oracle AWR Report, please read following article.
How to Read or Analyze an AWR ( Automatic Workload Repository ) Report in Oracle -3
Do you want to learn Oracle Database Performance Tuning detailed, then read the following articles.
Performance Tuning and SQL Tuning Tutorial in the Oracle Database
 IT Tutorial IT Tutorial | Oracle DBA | SQL Server, Goldengate, Exadata, Big Data, Data ScienceTutorial


good one.Thanks
Hi ,
Could you pls explain different wait events . When wait events occur and how to fix these events ?
Thanks
Ok I will continue to explain new wait events, keep in follow