 IT Tutorial IT Tutorial | Oracle DBA | SQL Server, Goldengate, Exadata, Big Data, Data ScienceTutorial
I will explain How to Analyze Interpret or Read an AWR ( Automatic Workload Repository ) report in Oracle in this article.

Analyze, Interpret or Read an AWR report
If you don’t know what is the AWR and how to generate it, read following article before this. Because I won’t explain these subjects in this article, I will just explain how to Analyze it.
AWR ( Automatic Workload Repository ) Report Read
Analysis AWR Report
When you examine this section in detail, the basic information about the Database, Database Server and AWR report are included. These informations are Database Name, Instance name,Startup, Version , Cluster, Database Server hostname, Server’s Platform, CPU number and RAM size etc.
Snapshots’ Begin and End time are also in this section. You need to specify right begin and End time before generate AWR report.
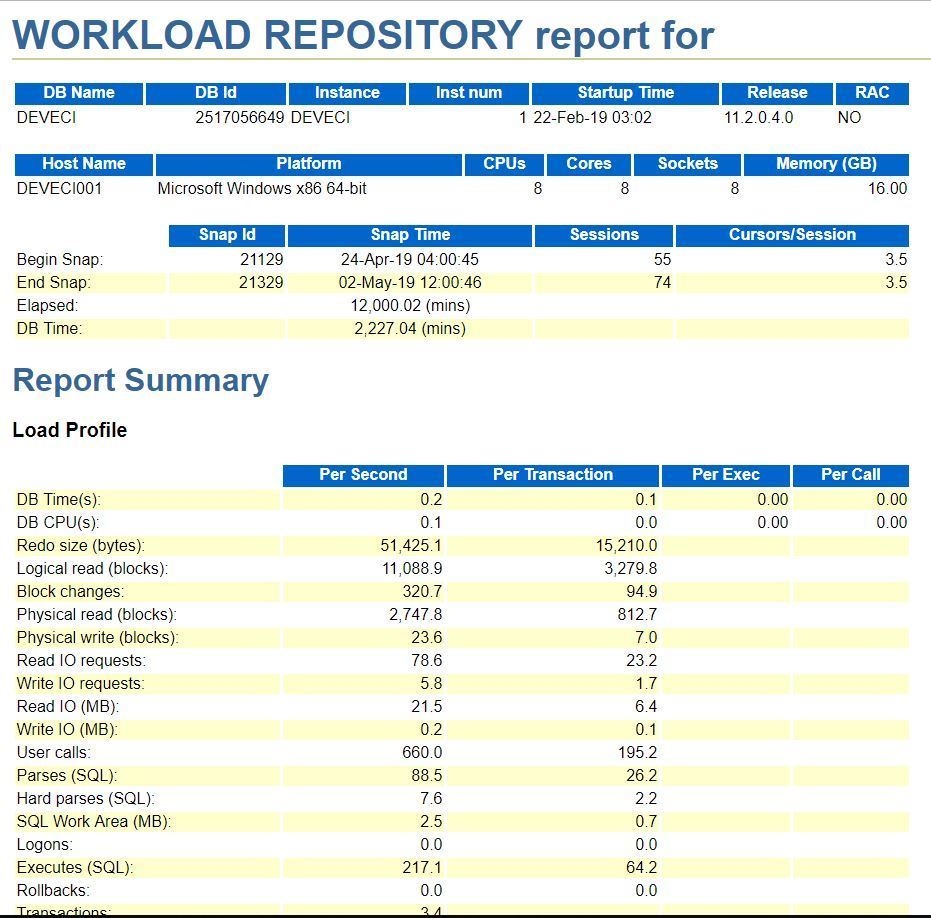
AWR Report – Load Profile
This section is one of the most important section in AWR Report. Because You can find out load of database from DB Time,Transactions, Hard Parse,Redo Size, Physical Read, Write and etc. value in units of per second and transactions per second.
If you want to decide right decision, you need to analyze in detail and compare AWR report with minimum two or three AWR report. These AWR reports should be last day’s and last week’s or month’s, namely they should be same load or similar load.
To find out whether Load profile’s value is high or not, compare these values with older AWR reports.
For example, If Transactions count are similar but DB Time is very high according to old , then Probably Database has Concurrency, Lock or other similar wait events.
If Physical Read and Writes have increased , you have storage problem or storage utilization has increased because of other factors or Your queries are problematic and they consume extremely resources.
If Hard Parse is very high ( Per Second 20-30 or more ), then your queries are not using Bind variables. You can check them with following script. It is highly recommended usage of Bind variables in the queries.
DB Time(s): Sessions elapsed time in the database. DB Time(s)=CPU Time + Waits.
DB CPU(s): Sessions elapsed time in the CPU.
Redo Size: Redo size ( byte ) between two snapshot.
Logical Reads: Logical read count in the database. Logical Reads= Consistent Gets + DB Block Gets
Block Changes: Block changes count between two snapshot.
Physical Reads: Physical read count in the database. If any block doesn’t exist in the memory, Oracle perform Physical read to get this block from datafile.
Physical Writes: Physical writecount in the database. If any clean block doesn’t write datafile yet, Oracle perform Physical write to write this block to datafile.
User Calls: The number of queries or calls sent to the database by the database users in the 2 snapshot range.
Parses: It is the sum of the Hard Parse and Soft parses that occur in the database in the 2 snapshot range.
Hard Parses: The number of Hard Parses occurring in the database in the 2 snapshot range. (If the query has not been run before, SQL is parsed and created its execution plan and stored in the Shared SQL area in the library cache. This operation is called hard parse.
W/A MB Processed: The number of Hash Join or Sort operations between 2 snapshot
Logons: The number of logon in the database between 2 snapshot
Executes: The number of executions
Rollbacks: The number of rollback operations
Transactions: The number of transactions between 2 snapshot
Top Foreground Events or Wait event Class
This section is also one of the most important sections in the AWR report. Because you can see Top Foreground Events,Top wait events or bottlenecks that causes performance problems in the database.
If Wait events are more than %5 or very high except DB CPU, then you need to analyze for each wait event.

I will explain each Wait event in the next posts in detail, because each Wait event affect database differently in terms of Performance.
I will continue to explain how to analyze AWR report in the next post.
You can access the second post of AWR report with the following link.
How to Read or Analyze an AWR ( Automatic Workload Repository ) Report in Oracle -2
Thanks for sharing and deep explanation ..
you are welcome, we have lots of tutorial about Oracle database. You can also review them.