 IT Tutorial IT Tutorial | Oracle DBA | SQL Server, Goldengate, Exadata, Big Data, Data ScienceTutorial
Hello, in this article, we continue the topic Unsupervised Learning.
Read the previous post before this post.
Dimension reduction
Dimension reduction finds patterns in data, and uses these patterns to re-express it in a compressed form. This makes subsequent computation with the data much more efficient and this can be a big deal in a world of big dataset.
Principal Component Analysis (PCA)
PCA performs dimension reduction in two steps, and the first one, called “de-correlation” , doesn’t change the dimension of the data at all.
Example
https://drive.google.com/file/d/1v6c5KhEXPvGinR0alinqYaqo-_of9agw/view?usp=sharing
You can access the entire linked code above.
import matplotlib.pyplot as plt
from scipy.stats import pearsonr

width = grains[:,0]

# Assign the 1st column of grains: length
length = grains[:,1]

# Scatter plot width vs length
plt.scatter(width,length)
plt.axis('equal')
plt.show()

# Calculate the Pearson correlation
correlation, pvalue = pearsonr(width,length)

# Display the correlation
print(correlation)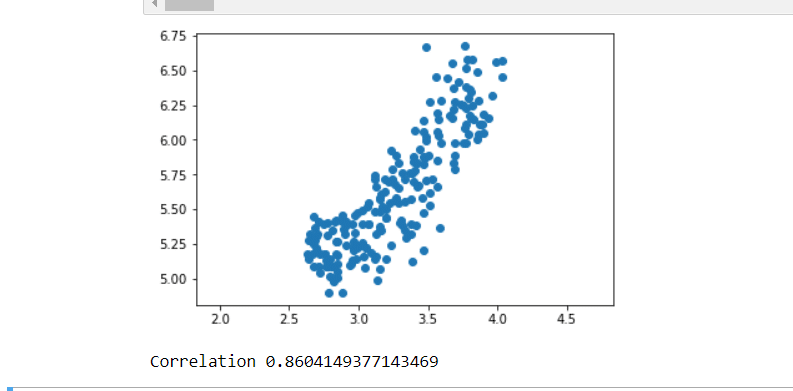
from sklearn.decomposition import PCA

# Create PCA instance: model
model = PCA()

# Apply the fit_transform method of model to grains: pca_features
pca_features = model.fit_transform(grains)

# Assign 0th column of pca_features: xs
xs = pca_features[:,0]

# Assign 1st column of pca_features: ys
ys = pca_features[:,1]

# Scatter plot xs vs ys
plt.scatter(xs, ys)
plt.axis('equal')
plt.show()

# Calculate the Pearson correlation of xs and ys
correlation, pvalue = pearsonr(xs, ys)

# Display the correlation
print(correlation)
See you in the next article