Hi,
I will continue to explain how to Troubleshoot Performance problems of SQL Server in this Article Series.
SQL Server Performance Troubleshooting
Read previous article before this.
https://ittutorial.org/sql-server-performance-troubleshooting-5-using-sql-server-profiler/
Collect Performance Data Using SQLDiag Tool
There are various tools to identify the slowness and problems that occur in SQL Server Databases. Some of these tools come with SQL Server, while some of the tools you need to install extra. These tools are as follows.
- SQL Server Profiler
- Performance Monitor ( Perfmon )
- SQLDIAG
- PSSDIAG
- RML Utilities
- Performance Analysis of Logs (PAL)
- SQL Nexus
I will collect performance data on a sample database that I created with SQLDIAG tool. Well, What performance data can we collect with SQLDIAG?
With SQLDIAG you can collect the following data.
- TOP SQL according to CPU, Memory and IO
- Windows and SQL Server Counter (Disk, Memory read / write) values.
- SQL Server Instance Configuration.
- Windows Event logs and SQL Server Logs.
Now let’s go to create a database named TestDatabase and create a table named testtable on on my Local computer, in my instance named MYTESTINSTANCE. I will create sample transactions in my TestDatabase database.
The sample script of the TestDatabase database and the TestTable table are as follows.
use master go create database TestDatabase go use TestDatabase create table testtable( col1 int identity(1,1) not null, col2 datetime null ) use TestDatabase alter table testtable add constraint DF_testtable_col2 default (getdate()) for col2 go
When you run this script successfully, the database named TestDatase and the table named testtable should be created in the local instance MYTESTINSTANCE as follows.
Create a parameter file called Configuration.xml as input for the SQLDIAG tool to read the required performance values. In this parameter file, I specified the addition of the above parameters with arrow as follows. You can download SQLDiag Configuration Tool by clicking this link.
I will appoint this Configuration.xml file as an input to the SQLDIAG tool, so I move this file under C: \ Program Files \ Microsoft SQL Server \ 100 \ Tools \ Binn.
The configuration.xml file has the same path as the SQLDIAG.exe tool as follows.
Now, with the SQLDIAG tool, I will assing the Configuration.xml file as input and collect performance data for the TestDatabase database.
Open Command Prompt and go to the path where the SQLDIAG tool is located.
After going to the path where the SQLDIAG path tool is, start the process of collecting performance data for 15 minutes, giving the Configuration.xml file as input and the output file to D: \ SQL_DIAG_OUTPUT path like following.
SQLDIAG Code:

SQLdiag /I Configuration.xml /O "D:\SQL_DIAG_OUTPUT" /E +00:15:00
When you run the above code, after waiting for a while it needs to indicate that process is started Data collection as follows
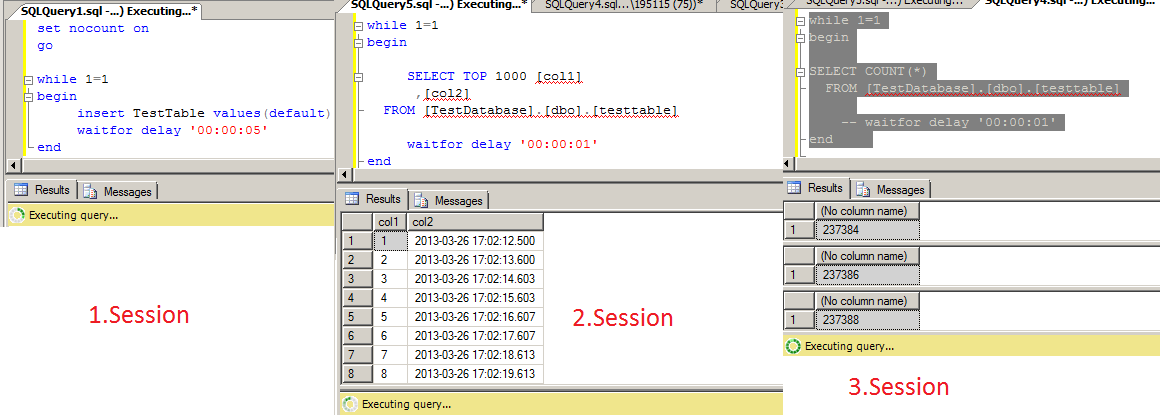
I have run some example Transaction like following to see in SQLDiag.
When you go to the D: \ SQL_DIAG_OUTPUT path, where you output the output file as follows, you can see that many trace files have been created as follows:
In my next article, I will read the data that i gathered in this article with the RML Utility tool and display costly queries and general information about the database in a report.
Do you want to learn Microsoft SQL Server DBA Tutorials for Beginners, then read the following articles.
SQL Server ( MSSQL DBA ) Database Tutorials for Beginners Database Administrators
 IT Tutorial IT Tutorial | Oracle DBA | SQL Server, Goldengate, Exadata, Big Data, Data ScienceTutorial


